

Thinking about moving to Silicon Valley? Whether you are relocating for a new job, searching for highly regarded schools, moving closer to family or simply looking for a different lifestyle, choosing where to live can feel overwhelming. Silicon Valley is not one single city. It includes a diverse collection of communities throughout the Peninsula, South Bay and portions of the East Bay. Home prices, commute times, neighborhood character, school districts and housing options can change significantly within just a few miles. Our free Living in Silicon Valley Relocation Guide was created to help you compare these communities and make a more informed decision about where to live.

Planning a move to Silicon Valley? Compare home prices and market conditions across San Mateo and Santa Clara County communities.
Building vs. buying a home in Silicon Valley? Compare land costs, construction timelines, financing and hidden expenses before deciding.
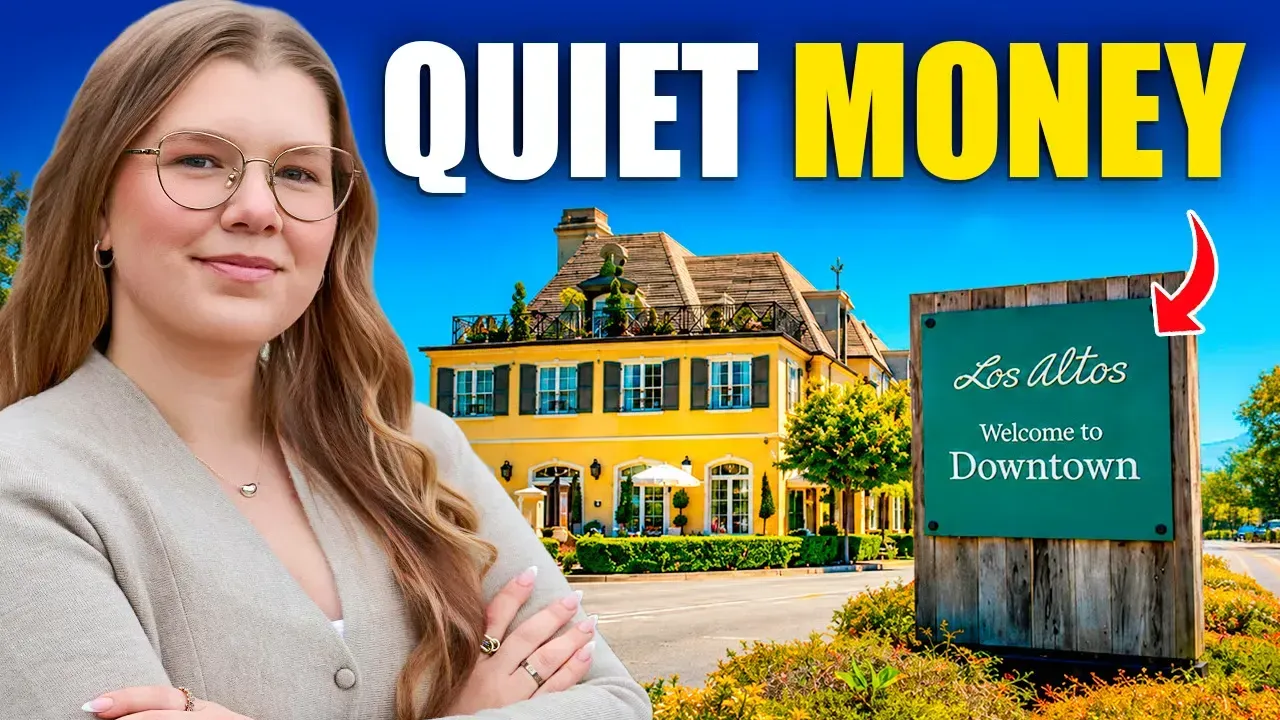
Drive through Los Altos and you might not even realize you've passed through one of Silicon Valley's most expensive ZIP codes. There are no famous gates, no tech campus banners — just tree-lined streets, single-story ranch homes, and a downtown that looks frozen in time. Then you see the price tags. The median Los Altos home is going for around $4.3 million. Homes go pending in about 10 days. And roughly 70% of homes sell above asking. This is what quiet money looks like — wealth that doesn't announce itself. In this guide, we'll walk through what that price actually buys, why an "invisible line" a few blocks wide can swing a home's value by hundreds of thousands of dollars, what daily life here really feels like, and how to know if Los Altos is actually the right fit for you — not just the right ZIP code.
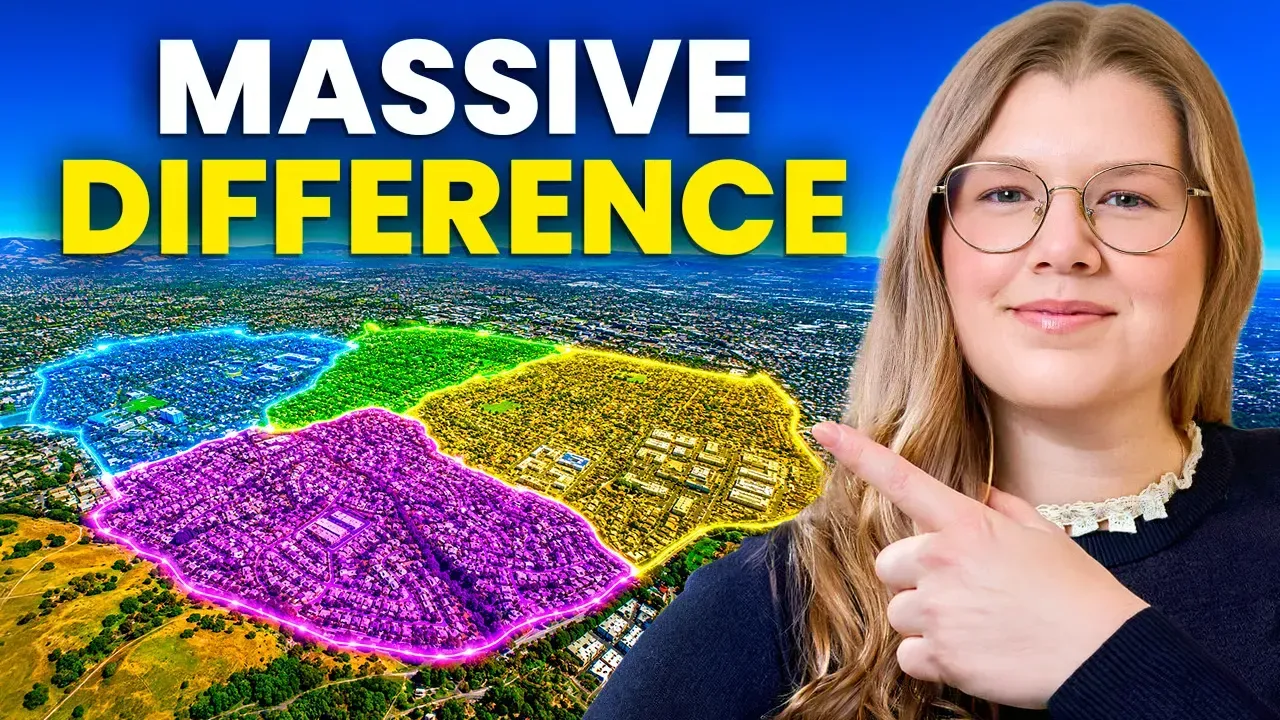
Picture this. You're stuck on the 101 on a Tuesday morning, three months into your dream house, two million dollars in — and someone else from your office is already at their desk. One decision separated you. The way you read the map. Silicon Valley has two maps: the one Zillow shows you, and the real one. The real one is built around five campuses, four commute zones, and a hidden transit system that most buyers never find. Get it right, and you save hundreds of hours a year — potentially millions of dollars. Get it wrong, and that house that felt perfect on a Saturday afternoon will feel very different on a Tuesday at 8 AM. Layer 1: Stop Thinking in Cities — Think in Campuses The biggest mistake buyers make is starting with a neighborhood. That's backwards. The real map of Silicon Valley is drawn around five anchor campuses: Apple Park — Cupertino Googleplex — Mountain View (near 101) Microsoft — Mountain View NVIDIA HQ — Santa Clara 650.436.4768 corridor) Meta — 1 Hacker Way, Menlo Park Same region. Five totally different maps. And each campus anchors four commute zones: Zone 1 (under 15 min) — The "No Excuses Zone" Zone 2 (15–30 min) — The "Sweet Spot" Zone 3 (30–45 min) — The "Volume Zone" Zone 4 (45+ min) — The "Commitment Zone" (but keep reading) Here's what surprises most buyers: most major tech companies are on 3-day office schedules now. That means you're commuting roughly 120 days a year, not 250. Cupertino's premium was built on five-day-a-week math that no longer applies. A lot of senior Apple employees should be looking at Zone 3, not Zone 1. Layer 2: The Rush Hour Multiplier Every drive time I just gave you? That's off-peak. The map you see on a Saturday tour is not the map you live on Monday morning. Once rush hour hits, a 15-minute drive can stretch to 30 or 45 on the 101, the 237, or the 880. A 30-minute drive can push past an hour. And rush hour isn't just 5–6 PM anymore — it builds mid-afternoon and runs into early evening. Here's the trap: buyers tour on a Saturday, the freeways are clear, the neighborhood feels like a 14-minute commute. They close on the house. Then Monday hits and the same drive takes 35. The worst bottlenecks to know before you buy: I-880 / I-680 interchange in Milpitas Long stretches of I-880 through the East Bay US-101 through Menlo Park and Redwood City If your commute touches any of these, test it on a Tuesday at 8 AM before you make an offer. Layer 3: The Hidden Shuttle System Here's the part most buyers never see — and it changes everything. Apple, Google, and several other major tech companies run massive private shuttle systems across the Bay Area. Google has stops across San Francisco and the Peninsula, with routes as far south as Morgan Hill and Gilroy. Apple connects San Francisco, the Peninsula, and parts of the East Bay all the way down to Cupertino. If you live near one of these stops, a 60–90 minute drive turns into something easy and predictable. You're not driving — you're working or decompressing. If you don't have access, your map snaps right back to highways and traffic. A house in Zone 4 with shuttle access gives you a Zone 2 commute at Zone 4 prices. We're talking price differences of $1–2 million on otherwise similar homes. Most buyers don't think about this until I show them the shuttle map. Layer 4: Return-to-Office Policy + The AI Wealth Shift Your RTO schedule is the multiplier on top of everything else. Three days a week at a 90-minute round trip is 234 hours a year. Five days is 390 — same house, completely different life. Where the major companies stand right now: Apple: ~3 days in office for most corporate roles Google: Generally 3 days per week Meta: 3-day hybrid Microsoft: Flexible, varies by team NVIDIA: Highly flexible, no company-wide RTO mandate For NVIDIA and Microsoft buyers especially, going to the office 2 days a week instead of 5 can translate to over $1 million in housing cost savings when you factor in how far you can comfortably live from campus. Suddenly Almaden Valley, Campbell, or even Tri-Valley starts making a lot of sense. And there's a third force reshaping this market: the AI wealth shift. Santa Clara County saw luxury home sales above $5 million climb over 50% in 2024, with momentum carrying into early 2025. Money tied to AI companies like NVIDIA is concentrating demand in very specific pockets — and the best commute locations and the wealthiest neighborhoods are increasingly the same places. The Order Most Buyers Get Wrong Most buyers start with the neighborhood. They should start with the campus. Here's the sequence that actually protects you: Campus first — which office are you actually going to? Return-to-office second — how many days a week do you actually have to be there? Shuttle access third — do you have a stop nearby? That one answer can expand your map by 30+ miles. Zone fourth — now look at where you can realistically afford to live, with real drive times, on a Tuesday morning. Get those four things right and you save hundreds of hours and potentially millions of dollars. Get them wrong and you're the person stuck on the 101 six months after closing, wondering why the commute doesn't match what the listing promised. Buying in Silicon Valley is one thing. Buying smart in Silicon Valley is about which map you used before you made the offer. Ready to figure out which zone actually fits your life? Send me an email at hello@liveinsiliconvalleyca.com — even a 10-minute conversation can give you a lot of clarity on where to look, and where to avoid.
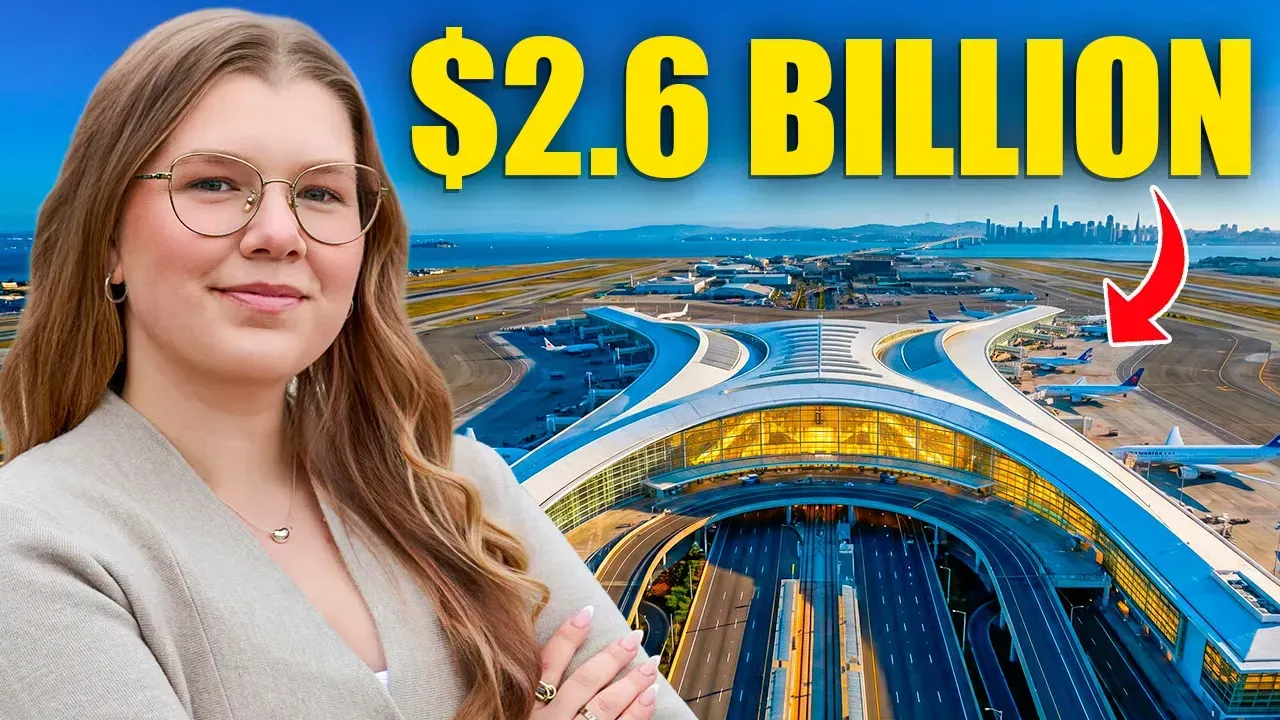
San Francisco Airport is spending $2.6 billion to rebuild half of one of its biggest terminals. Without ever closing the airport. Not once. Terminal 3 West. Opened in 1979. United's main hub for decades. After 40 years, it was overdue. But this isn't just an airport story. If you live on the Peninsula — or you're thinking about moving here — SFO shapes your week even when you forget it exists. And buried inside this project is one quiet design choice that reveals exactly what SFO expects this region to look like 20 years from now. That choice matters more than the price tag. Why SFO Is Rebuilding a Terminal From 1979 The obvious question: why spend billions on a building that's still standing? The western half of Terminal 3 opened in 1979. That's older than most of the planes flying in and out of it. And the problem isn't how it looks — a building from 1979 simply wasn't engineered to handle a major earthquake, modern security requirements, or the volume of passengers a major hub moves today. A significant piece of this project is structural seismic reinforcement. Keep that in the back of your mind — it becomes important later. Here's the scale: SFO is renovating the existing 650,000 square feet, then adding another 200,000 square feet of brand-new space on top. That's roughly a third more terminal. The difference between a check-in area that flows and one that wraps around the building. For context, the eastern half of Terminal 3 was already rebuilt and reopened in 2015. The western half was simply next in line. What $2.6 Billion Actually Builds The number sounds enormous until you see where it goes. Terminal 3 West is really three connected pieces: Renovation of the existing 650,000 square foot western half 200,000 square feet of entirely new space A brand-new 6-story building for airline lounges and office space That 6-story building is the one piece that opens a full year after everything else — and that's intentional, not a delay. For travelers, here's what the renovation actually delivers: a new curbside façade, expanded check-in with self-service bag drops, new security checkpoints including one on the upper level built specifically for AirTrain arrivals, and significantly more space for dining and retail. More than half of what you actually deal with at an airport happens before you reach your gate — the curb, check-in, security. That's exactly where most of this investment is going. The project is being built by Turner Construction, with Gensler and TEF Design handling the architecture. At peak construction, 500 to 600 workers will be on site. SFO has committed to directing more than $173 million in contracts to local businesses. How You Rebuild a Terminal Without Shutting Down the Airport SFO had one rule from the start: Terminal 3 could not close. Not even for a week. United runs too many flights through the building. So the work is being done in stages, phased across years: Fall 2027 — Renovated and expanded western half opens Early 2028 — New 6-story lounge and office building opens Early 2029 — Redone check-in lobby on the eastern side of Terminal 3 To keep passengers moving safely around an active construction site, SFO built temporary walkways past security. One connects Terminal 3 near Gate E2 to the round food court and the F Gates. A second links that food court to an existing walkway leading to the International Terminal G gates. In November 2025, SFO also closed the Terminal 3 AirTrain stop — it won't reopen until 2027. The Terminal 2 stop was renamed to serve both terminals in the meantime, with United shifting some check-in operations there. The Details Most Travelers Will Never Notice The features that cost the most — and matter the most — are usually the ones nobody sees. SFO is pursuing the highest green-building certification available for Terminal 3 West. The features behind that certification include: Lighting that automatically dims when natural daylight is sufficient A smart HVAC system that recaptures and reuses its own heat Rooftop solar panels generating on-site power Lower-carbon steel and concrete A modernized baggage handling system Electrochromic windows that adjust with light conditions Recycled water systems and hydration stations throughout Healthier interior building materials And then there's the seismic work. The upgrade you'll never see, and hopefully never need — but the one that makes the building genuinely safe for everyone inside it. For buyers who think in decades, not just a few years: a 1979 building was a slow structural liability waiting to matter. A seismically reinforced, high-efficiency terminal holds its value — and protects the surrounding region's infrastructure — for far longer than you'll own any single home. The Design Choice That Signals Where SFO Is Headed Most terminal rebuilds make an old building look new. This one is being built to do something the original terminal simply could not. Terminal 3 West is being built with flexible gates that can switch between domestic and international operations . One hour, wide-body international aircraft. The next, standard domestic routes. The same gate. For that to work, international passengers need a path to customs. So the project includes a new secure corridor giving arriving international travelers a direct route to the customs area in SFO's International Terminal — something the old Terminal 3 was never designed to provide. This is the quiet choice I promised at the top. SFO didn't have to do this. A simpler, less expensive rebuild could have kept Terminal 3 West as a domestic-only facility. They chose not to. And that decision tells you something no press release ever would. Why It Matters to You If you fly internationally for work, this directly changes your day. Landing from overseas at SFO currently means a long, exhausting walk between terminals after an already brutal flight. A Terminal 3 equipped for international gates is a terminal built around your schedule. If you primarily fly domestic, it still matters — just differently. SFO is placing a very deliberate bet that this region will draw significantly more international travelers in the years ahead. Here's the data backing that bet: In 2024, international travel at SFO jumped 12%, reaching 15.8 million passengers. International flights now represent roughly 30% of all traffic moving through the airport. A terminal engineered to flex between domestic and international traffic is a terminal built for an airport that expects that growth to keep climbing. What This Means for the Peninsula SFO didn't rebuild Terminal 3 West for how busy it is today. They built for how busy it's going to be 20 years from now. That's a long-term institutional bet on this entire region — and the kind of signal worth paying attention to when you're deciding where to put down roots. When an airport commits $2.6 billion to expanded international capacity, it's not optimizing for the present. It's investing in a future where the Peninsula pulls in more global travelers, more international business, and more sustained demand year after year. Infrastructure investment at this scale doesn't just improve travel. It anchors long-term regional desirability. And long-term regional desirability shows up in home values — well before it shows up on anyone's boarding pass. The Peninsula keeps building for its own future. That's exactly the kind of signal I watch for when buyers ask me where this market is really headed. Thinking About a Move to the Peninsula? If you're weighing a move and want to understand what's actually driving this market — beyond the headlines — I'd love to talk through it. I work with buyers and sellers directly across Redwood City, Menlo Park, Atherton, and the broader Bay Area. No handoffs, no assistants. Just me, from first conversation to closing. 📞 Call or text: 650.436.4768 🌐 Thinking about buying or selling? Schedule a discovery call or reach out to me directly! Even a 10-minute conversation can give you real clarity before a decision this size. And as always — every transaction I close supports the Homes for Paws Initiative , donating a portion to local no-kill animal shelters on the Peninsula. 🐾